New clustering algorithm "VT-Shift"
People: Nikolay Samusik, Yannis Kalaidzidis
Statistical analysis of multiparametric phenotypic profiles
Quantitative multiparametric image analysis provides us with multidimensional phenotypes of gene loss of function induced by RNAi. This multidimensionality of readout brings the power to distinguish between multiple ‘kinds’ of phenotypes that could be produced by perturbing different components of the endocytic system. After profiling a large series of gene RNAi in a phenotypic screen, we expect that genes that regulate the system functions in the similar way tend to produce similar phenotypes, as measured by correlation of phenotypic profiles. We can learn much about the systems architecture by establishing groups of genes that produce the same ‘kind’ of phenotype, as those groups are likely to represent ‘functional modules’ – sets of proteins that together carry out a certain set of functions. We seek to identify those groups by means of phenotypic profile clustering. Data clustering is generally a difficult problem, as its aim is to group the profiles together without using any prior information: the number of groups, their size and membership has to be learned from the data altogether.
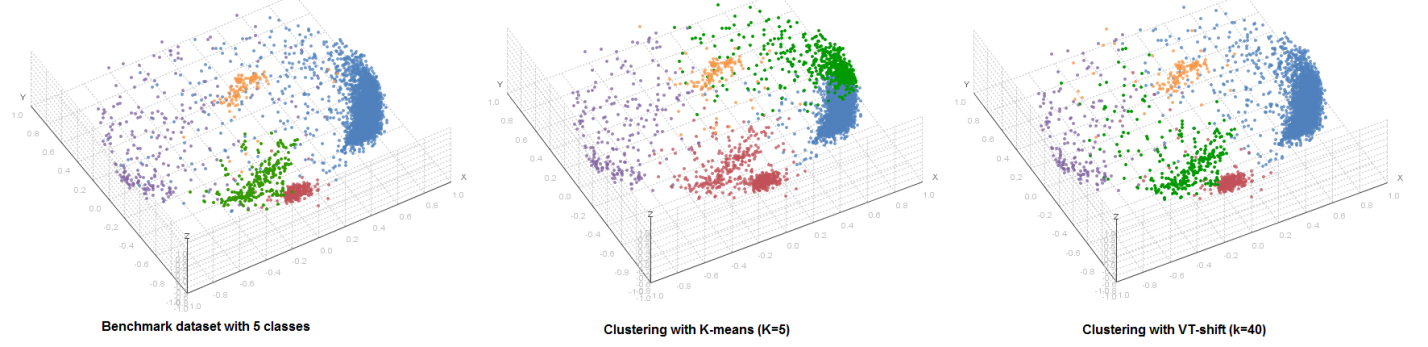
We take a density-based approach to clustering to clustering that, unlike most similarity-based methods (like K-means and hierarchical clustering) doesn’t require the assumptions about cluster shape and size. We developed our own clustering algorithm called VT-shift that is specifically tailored to the multidimensional data and is intrinsically capable of providing an unbiased estimate of the true number of classes in the dataset.
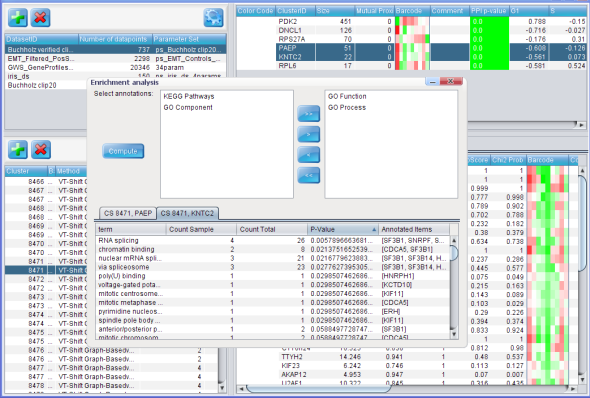
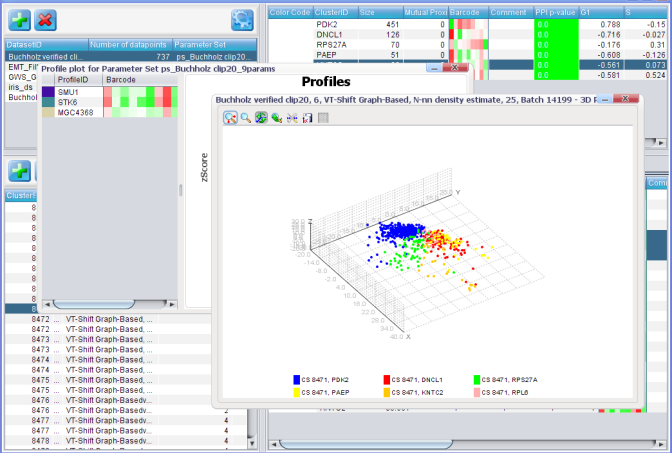
We develop a GUI-based software package that integrates the VT-shift and other clustering methods, cluster visualization, hit selection and bioinformatics analysis. The pipeline can be applied to a variety of multiparametric datasets such as phenotypic profiles of RNAi and chemical screens and gene expression profiles from microarray/RNAseq experiments.
Data integration
Phenotypic groups together the genes that are likely to share a certain function. In order to find out what those functions are, we test whether the phenotypic groups are enriched in groups of interacting proteins or in certain gene annotation terms, such as Gene Ontology and KEGG pathways. We are also seeking to employ the gene annotation and protein interaction data as priors for gene profile clustering in order to obtain more coherent and functionally relevant groups of phenotypes.
In order to get a more comprehensive overview of the system, we bring together RNAi phenotypes obtained in different assays. For instance, the ongoing analysis of combined RNAi profiles from the endocytosis assay and the cell cycle screen (Buchholz lab) reveals functional and regulatory links between endocytic cargo trafficking and the regulation of cell division.
Another direction of data integration is to employ the quantitative phenotypic information to predict drug targets. Since drugs and RNAi treatments that act on the same cellular functions are likely to show similar phenotypes on a cellular system, we can predict the targets of selected drugs by profiling their effect in the endocytosis assay of the genome-wide screen, selecting gene RNAi profiles that show similar phenotypes and analyzing which pathways and gene annotations are overrepresented among those genes.
Bayesian Network analysis
Bayesian networks are graphical models that encode probabilistic dependencies within a system of variables. It also explicitly encodes probabilistic independencies, so that if two variables are not connected with an edge, it means that there exists a set of variables, holding which makes the two variables independent. The network can be reconstructed from a set of static observations of systems states. We use the network reconstruction as a data-driven modeling approach that can reveal interesting aspects interplay between systems variables, such as causal dependencies.
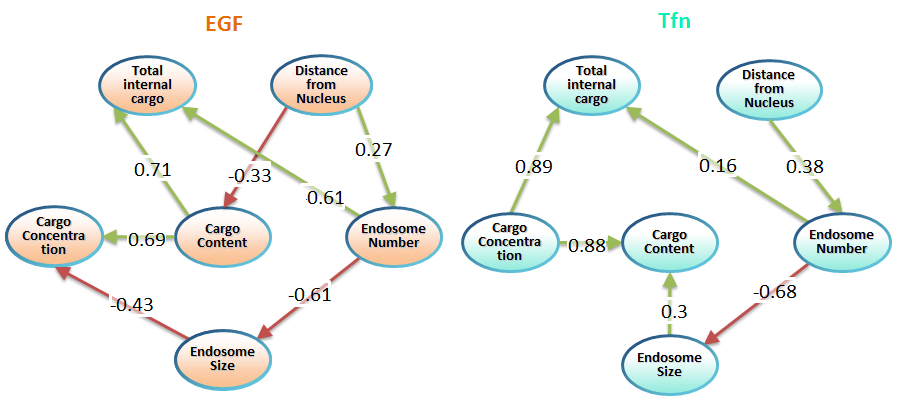
We reconstructed the parameters of cargo distribution in endosomes measured in the genome-wide screen on endocytosis, separately for EGF and transferrin. The comparison of the network structures for EGF (‘active’ signaling cargo) and Tfn (‘passive’ metabolic cargo) revealed fundamental design principles of the endocytic system. For instance, the mean content of EGF in the population of endosomes is independent of the mean size. At the same time, the total amount of internalized EGF depends on the number of EGF vesicles. Those observations allowed us to formulate a hypothesis that EGF receptor is packaged upon internalization into multiple vesicles and each of them contains a defined amount of EGF receptor. Those vesicles act as ‘signaling quanta’, where each vesicle produces certain amplitude of signal, and the total signal output depends on the number of vesicles. The validation of this hypothesis is currently ongoing.
Obtaining more data on how the inhibition of individual genes affects the distribution allows us to expand the Bayesian network by adding the variables that describe the state of functional subpopulations of endosomes defined by combinations of different markers (Rab5, Rab11, APPL, EEA1 etc). This more detailed model is expected to provide the quantitative information on regulation of endocytic trafficking throughout different endosomal compartments.